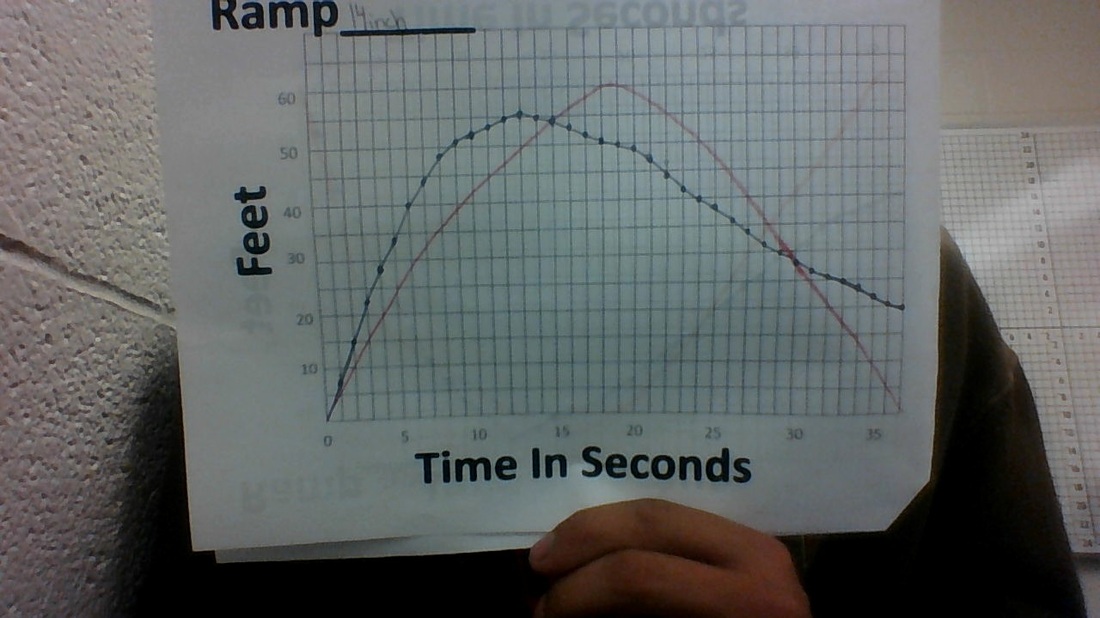
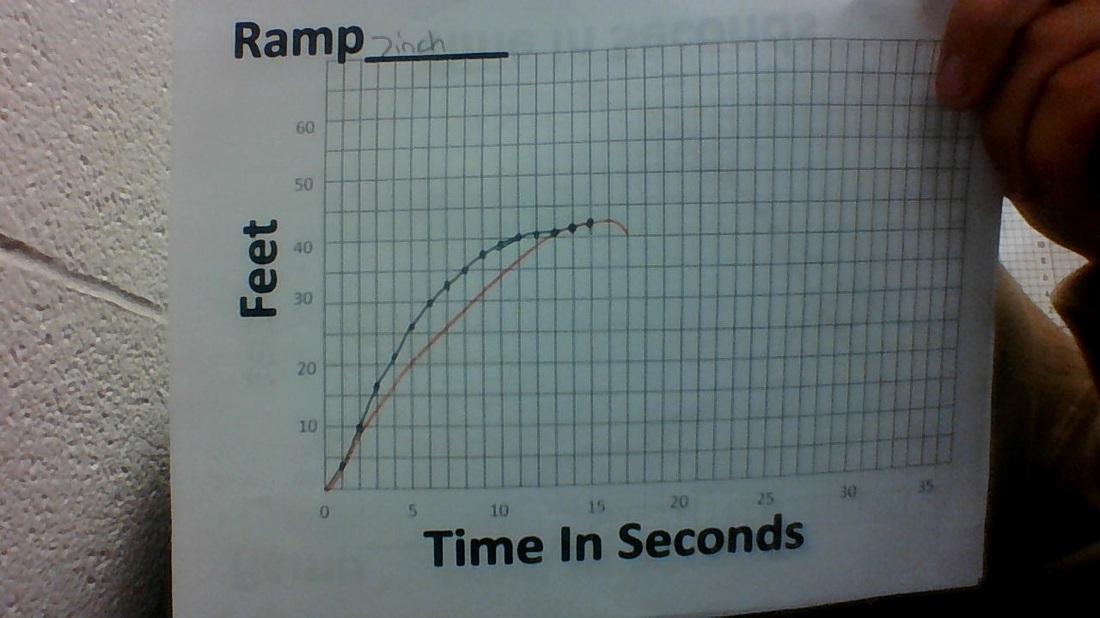
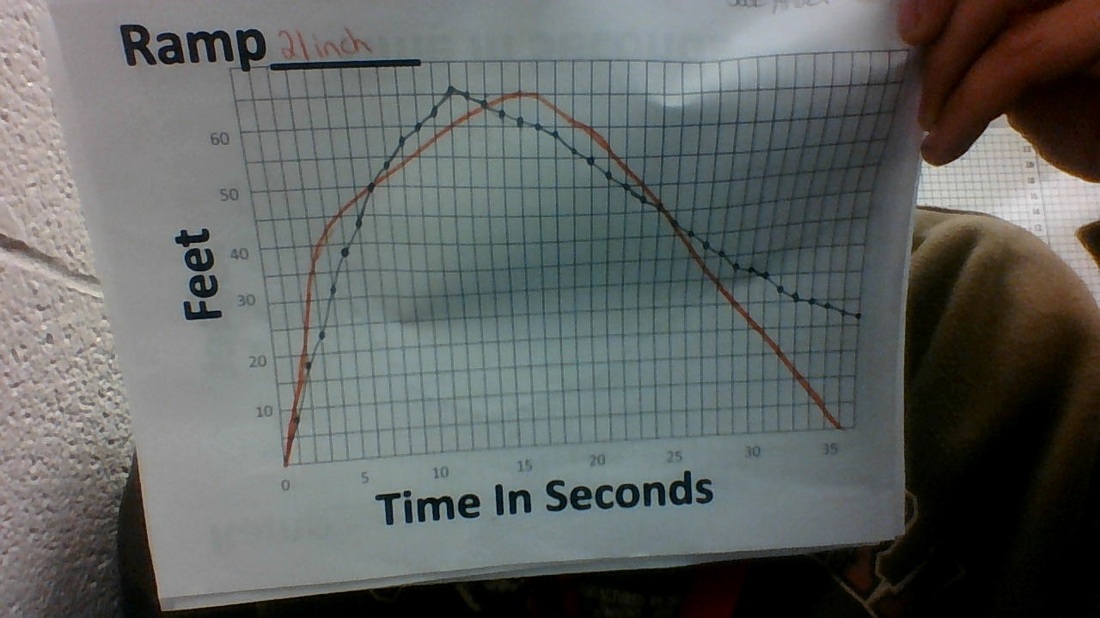
A.On the first graph (14 inch) I was a little off because i didnt think the board would travel so fast and have a low max distanceand travel backwards quite a bit slower then it went forward.On the second graph ( 7 inch) i was really close i just had the seconds off from the distance by maybe a second a foot. And on the third graph (21 inch) I predicted that the speed on the board was going to travel faster and slowly rise to the peak and roll backwards faster then when it traveled forward but i was wrong.
B. 21 inch ramp=(0,65)U(65,20)
14 inch ramp=(0,55)U(55,22)
7 inch ramp=(0,43)
C. Between all the ramps the 21 and 14 inch ramps they both had similar maximums. And the the maximum on the 7 inch ramp doesnt have nearly close to as high of a maximum as the other 2 graphs but it just stops there and the other 2 decrease from their maximums.
D.The graph rises the fastest when the board is just leaving the ramp and the fastest the graph drops is when the board starts to pick up speed when rolling backwards.
E.Pictures are posted above.

 RSS Feed
